

Volatility, measured by the CBOE VIX Index has recently shown a significant uptick. But, what is the VIX and why is it important?
The Chicago Board of Options Exchange defines the VIX Index as:
A calculation designed to produce a measure of constant, 30-day expected volatility of the U.S. stock market, derived from real-time, mid-quote prices of S&P 500® Index call and put options. On a global basis, it is one of the most recognized measures of volatility — widely reported by financial media and closely followed by a variety of market participants as a daily market indicator.
The street views it as the implied volatility of a hypothetical S&P 500 option with 30 days to expiration. In other words, it is a tool that can be used to better understand the perception of risk, or volatility over a period of time.
Many investors think of it as the fear index. This is because volatility is often associated with downside moves for equities. This is often the case and why some investors will utilize VIX options as a way to hedge out risk in a portfolio. However, volatility can actually be considered as both up- and downside movement for stocks and equity indices.
When volatility rises, there is a much wider range of potential returns that can be achieved. Daily swings can be enormous and that will often hit sentiment. Investing in a volatile market, in the short run, is challenging as price movements are exaggerated adding another layer of risk. What we have seen in the past is that when volatility rises, daily swings can become so unruly that decision making is difficult. Therefore, many would rather take down position and wait until volatility subsides.
On the other hand, when volatility is low, investors have an implicit green light to keep money invested as the range of returns is much more manageable on a short-term basis. Think about those times that markets are up 2% one day and then down 2% the next. Or when stocks start out down 5% and end up 1% by the end of the day, only to drop hard the next. Trying to invest, even for the long-term under those conditions is very difficult. Even the most bullish thesis comes under pressure when markets are swinging wildly.
2018 marks an interesting change in the texture of markets. Prior to this year, volatility was subdued. In fact it was one of the quietest periods in decades. Over the 12 months of 2017, the 50-day average for the VIX Index was just above 10. While there were a few days that the VIX spiked, we also saw many days that it closed near 9. That is actually quite incredible considering it marks one of the lowest and longest periods of contained volatility in history.
Historically, the average for the VIX has been closer to 15. Therefore, 2017 had approximately 50% less volatility expectations being expressed through the VIX Index. That makes a whole lot of sense. During that year, the movement of the S&P 500 index occurred in tight ranges on a daily basis. A little up, a little down. Since investors had little to worry about with the potential for crazy swings and wide ranges, they were much more comfortable putting money to work in stocks on a regular basis. This helped to provide exceptional returns for the year as investor sentiment was lifted by price stability.
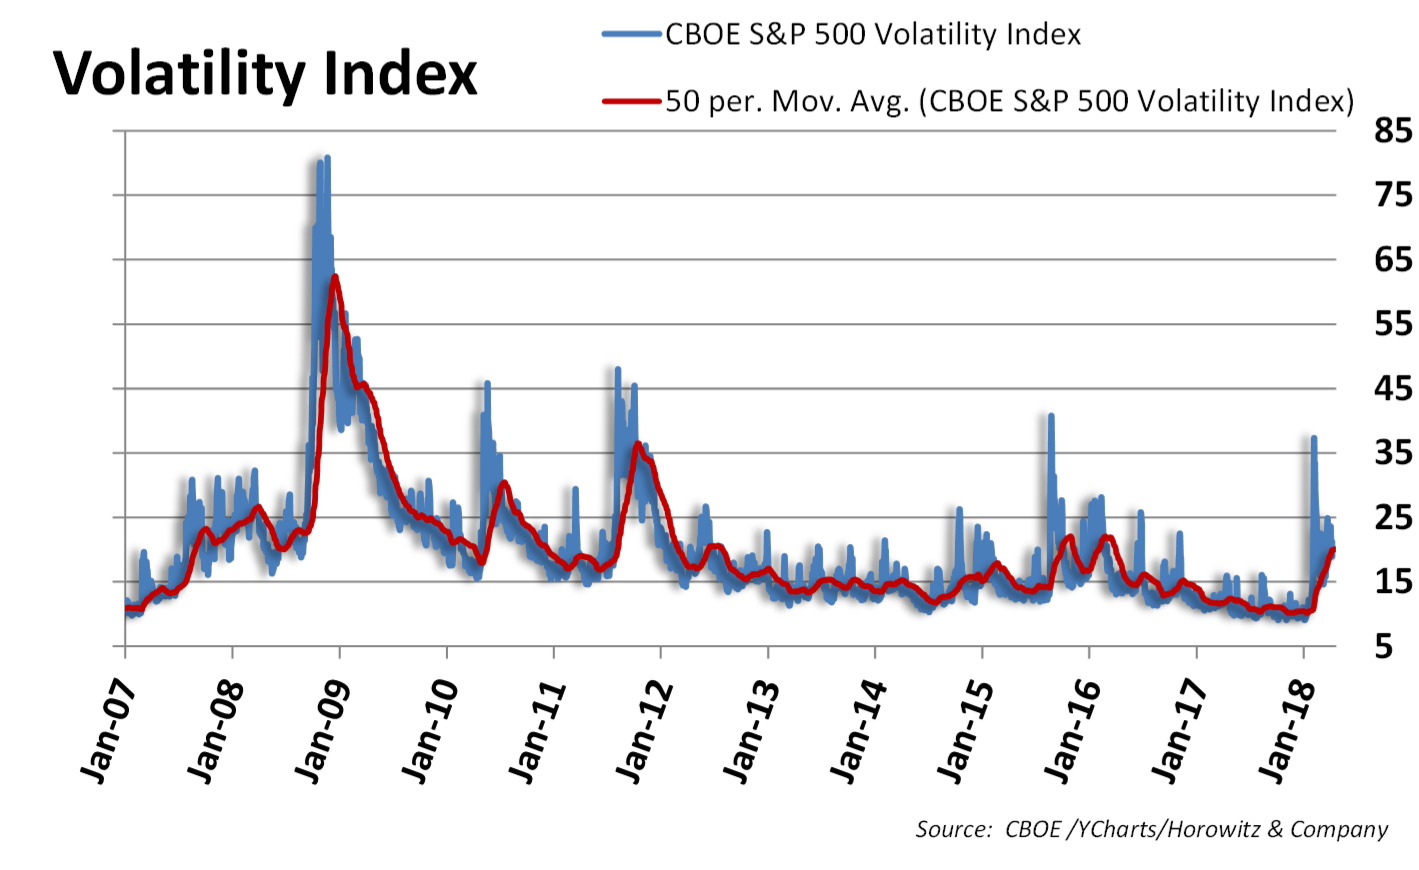
With headline risk at the highest level we have seen in some time and the Fed looking to raise rates throughout the year, a return to “normal” levels of volatility is logical. At the end of the first quarter, the VIX closed above 20. The average over the past 50 days headed up to 20 as well. What this is telling us is that we should be prepared, in the short-term, for wider ranges (up and/or down) for the time being.
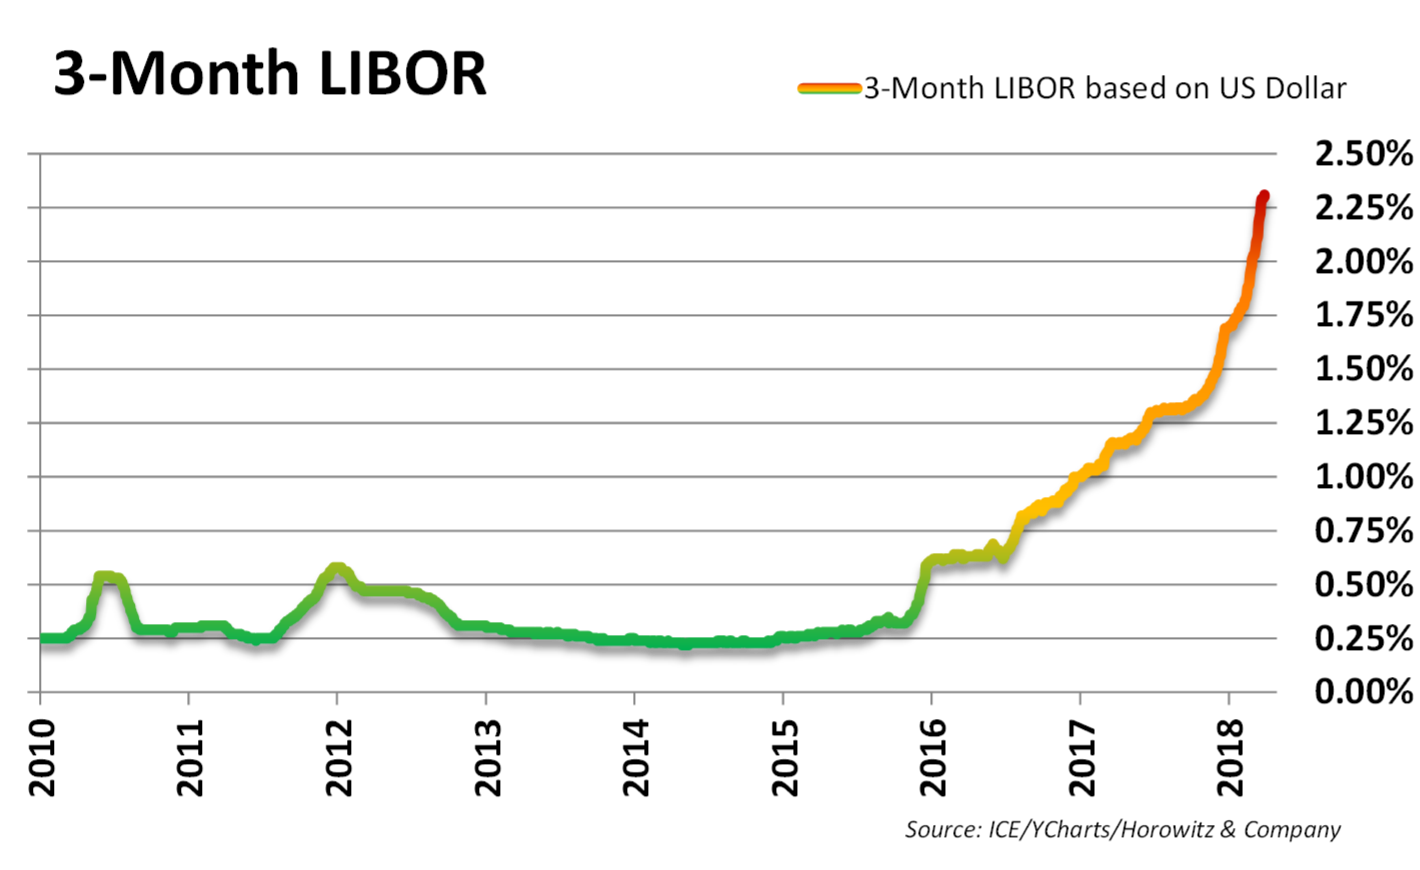
Some of the heightened volatility is due to a general reduction in liquidity as the Fed has been drawing down excess stimulus. In addition, there are far fewer shares available as trillions of dollars have been spent on stock buybacks over the past ten years. Finally, as rates move higher, the cost of funds (margin) increase to a point that leveraging positions is not as profitable. Many short term rates, including portfolio and investment margin, are tied to the London Inter-bank Offered Rate or abbreviated LIBOR. Generally, they are quoted as LIBOR plus a fixed percentage rate like LIBOR + 1.50%. This allows the firm providing the loan or margin to have a fixed profit percentage as they are protected by the floating LIBOR interest rate. As you can see in the chart above, LIBOR has moved up by a little more than 2.00% in a very short period of time. This increase in rate, while still relatively low compared to other decades, may start to impact investors and their use of leverage within portfolios.
So, what does this all mean to the average investor? What changes should be made to longer-term, well diversified portfolios? Moves toward diversifying into lower beta investments with lower correlations to equities is probably a good idea – if not already incorporated into your strategy. For our clients, we have taken steps over the past several months to do just this. This is just part of the process as we carefully consider the market landscape. One thing to note: short-term increased volatility has little impact over time. The longer the time horizon, the less important short-term volatility becomes.
For active traders it is another story altogether. In fact, the shorter one’s time horizon is, the greater the potential for volatility to provide opportunity to the skilled or lucky. The important takeaway is this: As long as an investor understands their own time horizon/ risk tolerance and diversifies their portfolio accordingly, they will be much better able to deal with volatility over time.